Type and Magnitude of Non-Employee Director Compensation Increases - Observations from FW Cook’s 2024 Director Compensation Report
By Tahmid Ali, Consultant
Share
An analysis of multi-year trends in non-employee director compensation revealed that approximately 35% - 40% of companies made program adjustments in any given year. Most elected to increase the equity component only or coupled increases in the cash component with a corresponding increase in equity. The analysis further revealed the following takeaways that indicate that the director compensation market has become increasingly uniform over the last decade:
- The overall variability in director compensation adjustments has fallen significantly.
- The magnitude of the “typical” annual adjustment (indicated by the median) has increased.
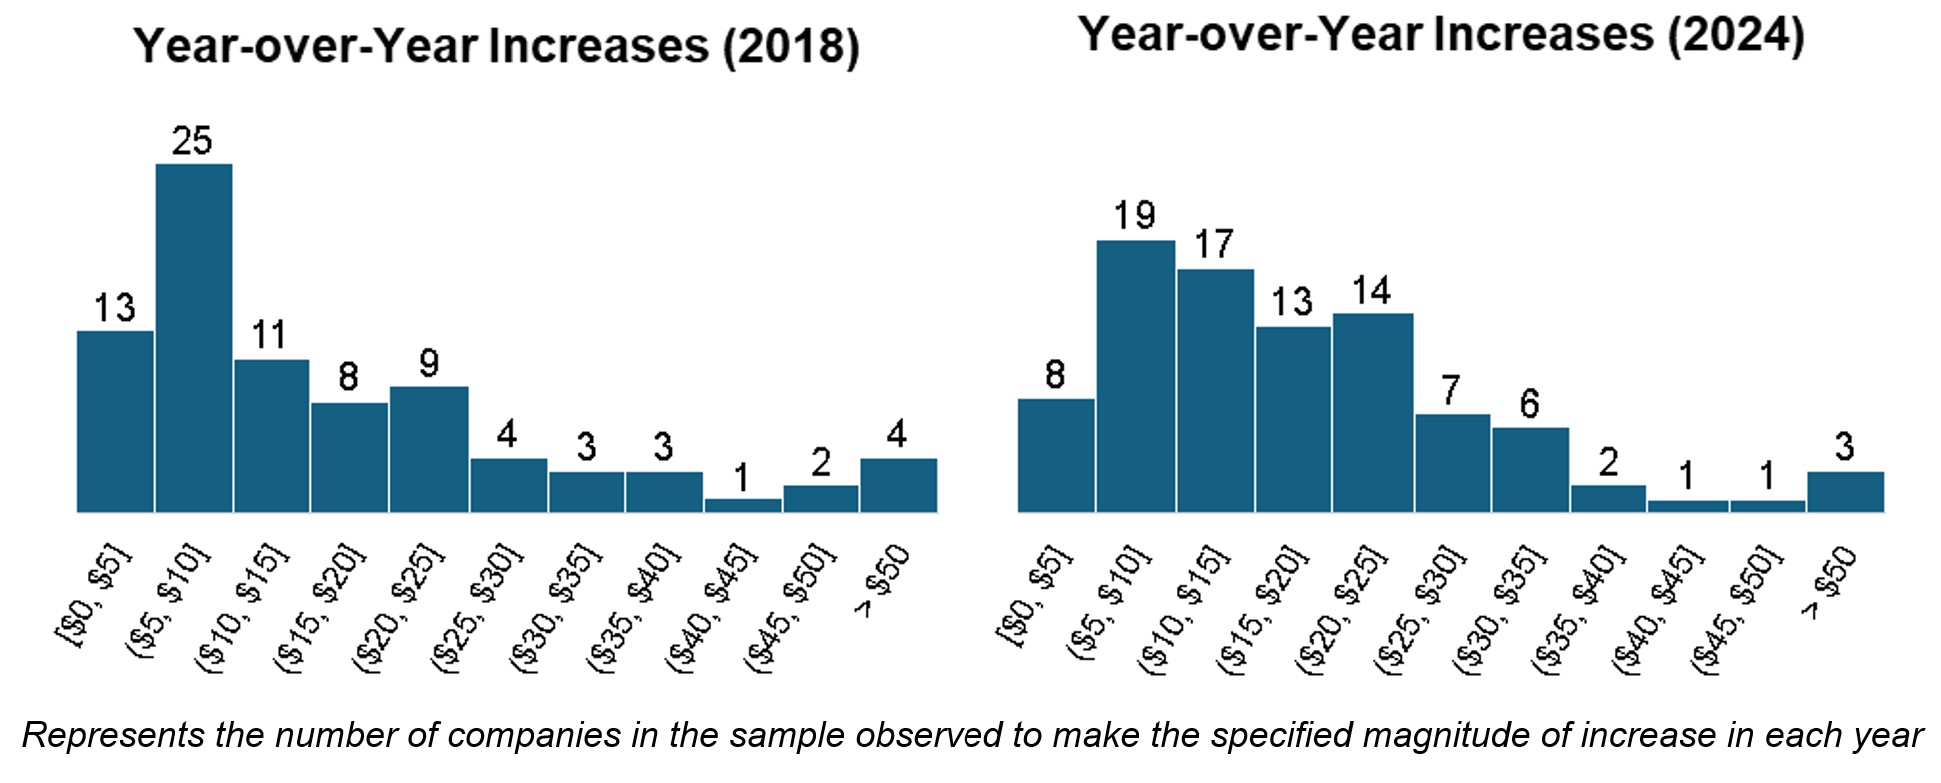
- The fraction of companies making larger adjustments (e.g., between $15K and $30K) has correspondingly increased, while the prevalence of outliers (companies making very small or very large adjustments) has fallen.
- The above observations were consistent across all three size segments reviewed (i.e., small, mid-, and large-cap).
Year-over-Year “Core” Program Adjustments
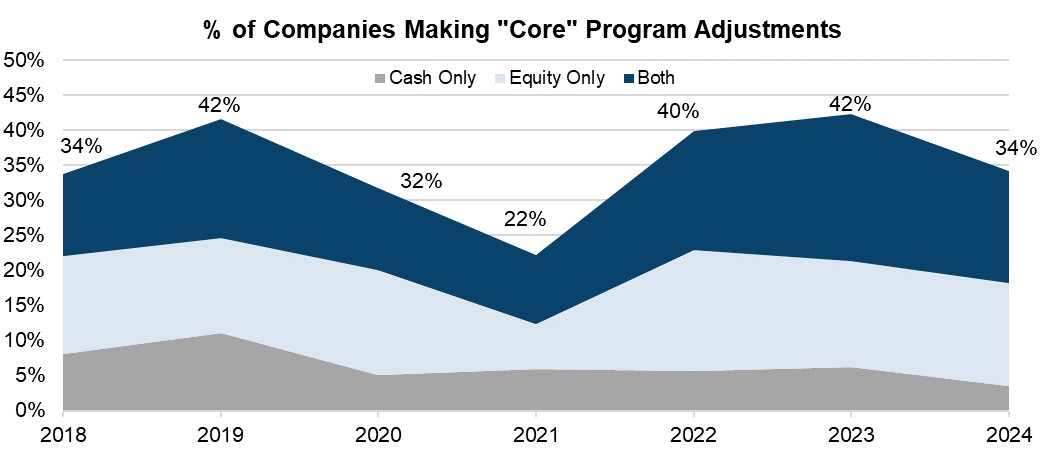
The following graph illustrates the fraction of companies adjusting their “core” program (i.e., annual Board cash and equity retainers) year-over-year, which has generally remained within the 35% - 40% range, except for a significant plunge in the first years of the pandemic due to companies delaying increases and a corresponding rise in the following years back to pre-pandemic levels.
Among the companies making adjustments, the fraction making “cash only” increases has fallen from ~25% of this group in 2018 to only 10% in 2024, with the remainder split between “equity only” and “cash and equity” increases. This is attributed to continued focus and pressure to maintain alignment with shareholders by focusing pay increases in equity compensation (or only providing cash increases alongside equity increases) and can also be seen in the modest shift in pay mix toward equity over the analyzed period (58% of total pay in the 2017 study, the year preceding the analyzed period, vs. 62% in 2024, the final year of the analyzed period).

Median Annual Increases
To illustrate the growing uniformity in director compensation levels, the following table summarizes the median total increase in each analyzed year, as well as the overall variability in director compensation increases (defined as the ratio of the standard deviation to the average, representing the overall spread in magnitude of year-over-year increases, with a higher percentage indicating a greater degree of variability and vice versa). In addition, the following histograms illustrate the distribution of observed year-over-year increases in 2018 compared to 2024.


These observations, coupled with the observed trend that pay ranges continue to narrow (see full 2024 study for further detail), clearly illustrate the significantly reduced variation in the magnitude and type of year-over-year adjustments, as well as overall pay levels. We believe that enduring focus on director compensation, coupled with the risk of potential litigation, will continue to drive this trend in uniformity forward, as companies are eager to avoid being perceived as outliers, while maintaining competitive programs in a market with high demand for qualified and talented directors.
 Tahmid Ali
Consultant
Tahmid Ali supports clients in all areas of executive and director compensation, including compensation reviews, peer group development, short-and long-term incentive design analyses, corporate governance, and navigating Say-on-Pay. He has experience with companies across industries of all sizes and stages of development, including private, pre-IPO, and mature public companies.
